

| Rs. in Crores except share data | |||||||||
| (Approved by the Board of Directors on 10-11-2010 after review thereof by the Audit Committee) |
|||||||||
| Sl. No. | Particulars | Three Months
ended 30-9-2010 (Unaudited) |
Three
Months
ended 30-9-2009 (Unaudited) |
Six Months ended 30-9-2010 (Unaudited) |
Six Months ended 30-9-2009 (Unaudited) |
Previous
Accounting year ended 31-3-2010 (Audited) |
|||
| 1. | |||||||||
| a. | Net Sales / Income from Operations |
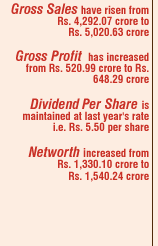
Note 1 | 1,271.89 | 1,198.03 | 2,767.06 | 2,428.15 | 5,020.63 | ||
| b. | Other Operating Income |
Note 8 | 62.62 | 17.53 | 78.82 | 38.60 | 83.38 | ||
| Total | 1,334.51 | 1,215.56 | 2,845.88 | 2,466.75 | 5,104.01 | ||||
| 2. | Expenditure | ||||||||
| a. | (Increase) / Decrease in stock in trade and work in progress |
(132.29) | (92.68) | (222.24) | (89.39) | (173.07) | |||
| b. | Consumption of Raw Materials |
792.29 | 562.20 | 1,596.22 | 1,051.26 | 2,372.19 | |||
| c. | Purchase of traded goods |
6.28 | 11.88 | 14.14 | 16.05 | 33.11 | |||
| d. | Employee Cost | 67.35 | 56.26 | 128.58 | 106.20 | 225.29 | |||
| e. | Depreciation (Net of Transfer from Revaluation Reserve) |
64.00 | 41.66 | 127.11 | 77.87 | 172.80 | |||
| f. | Power and Fuel | 179.15 | 163.22 | 363.71 | 310.22 | 624.23 | |||
| g. | Excise Duty | 82.61 | 70.62 | 179.86 | 143.26 | 299.97 | |||
| h. | Packing and Carriage |
123.09 | 95.77 | 244.27 | 195.34 | 432.37 | |||
| i. | Other Expenditure |
160.05 | 140.04 | 328.37 | 282.59 | 574.29 | |||
| Total | 1,342.53 | 1,048.97 | 2,760.02 | 2,093.40 | 4,561.18 | ||||
| 3. | Profit / (Loss) from Operations before Other Income, Interest and Exceptional Items (1 - 2) |
(8.02) | 166.59 | 85.86 | 373.35 | 542.83 | |||
| 4. | Other Income | 17.66 | 2.96 | 20.60 | 16.18 | 41.69 | |||
| 5. | Profit / (Loss) before Interest and Exceptional Items (3 + 4) |
9.64 | 169.55 | 106.46 | 389.53 | 584.52 | |||
| 6. | Interest | 57.28 | 27.06 | 102.48 | 58.11 | 109.03 | |||
| 7. | Profit / (Loss) after Interest but before Exceptional Items (5 - 6) |
(47.64) | 142.49 | 3.98 | 331.42 | 475.49 | |||
| 8. | Exceptional items | - | - | - | - | - | |||
| 9. | Profit / (Loss) from Ordinary Activities before tax (7 + 8) |
(47.64) | 142.49 | 3.98 | 331.42 | 475.49 | |||
| 10. | Tax Expense | ||||||||
| a. | Provision for Current Tax |
Note 2 | (5.96) | 20.00 | 0.04 | 45.00 | 36.00 | ||
| b. | Provision for Deferred Tax charge / (credit) |
(9.09) | 46.00 | 0.91 | 112.00 | 202.28 | |||
| c. | Provision for Fringe Benefit Tax (Net) |
- | (0.38) | - | - | (0.13) | |||
| 11. | Net Profit / (Loss) from Ordinary Activities after tax (9 - 10) |
(32.59) | 76.87 | 3.03 | 174.42 | 237.34 | |||
| 12. | Extraordinary Items (net of tax expense Rs. Nil) |
- | - | - | - | - | |||
| 13. | Net Profit / (Loss) for the period (11 - 12) |
(32.59) | 76.87 | 3.03 | 174.42 | 237.34 | |||
| 14. | Paid-up Ordinary Share Capital (Face Value Rs.10.00 per share) |
45.74 | 45.74 | 45.74 | 45.74 | 45.74 | |||
| 15. | Reserves excluding Revaluation Reserve as per Balance Sheet of previous accounting year |
1,491.11 | |||||||
| 16. | Earnings Per Share (EPS) |
||||||||
| a. | Basic and Diluted EPS before Extraordinary Items (Rs.) |
(7.12) | 16.81 | 0.66 | 38.13 | 51.88 | |||
| b. | Basic and Diluted EPS after Extraordinary Items (Rs.) |
(7.12) | 16.81 | 0.66 | 38.13 | 51.88 | |||
| 17. | Debt Service Coverage Ratio |
Note 12 | 2.28 | 8.04 | 6.95 | ||||
| 18. | Interest Service Coverage Ratio |
Note 12 | 2.28 | 8.04 | 6.95 | ||||
| 19. | Public Shareholding |
||||||||
| – | Number of shares |
2,67,01,709 | 2,65,60,829 | 2,67,01,709 | 2,65,60,829 | 2,65,92,150 | |||
| – | Percentage of shareholding |
58.37% | 58.06% | 58.37% | 58.06% | 58.13% | |||
| 20. | Promoters and Promoter Group Shareholding |
||||||||
| a. | Pledged / Encumbered |
||||||||
| - | Number of shares |
Nil | Nil | Nil | Nil | Nil | |||
| - | Percentage of shares ( as a % of the total shareholding of promoter and promoter group) |
Nil | Nil | Nil | Nil | Nil | |||
| - | Percentage of Shares ( as a % of the total share capital of the company) |
Nil | Nil | Nil | Nil | Nil | |||
| b. | Non encumbered |
||||||||
| - | Number of shares |
1,19,99,734 | 1,21,40,614 | 1,19,99,734 | 1,21,40,614 | 1,21,09,293 | |||
| - | Percentage of shares ( as a % of the total shareholding of promoter and promoter group) |
100% | 100% | 100% | 100% | 100% | |||
| - | Percentage of Shares ( as a % of the total share capital of the company) |
26.23% | 26.54% | 26.23% | 26.54% | 26.47% | |||