| 2009-10 | 2008-09 | 2007-08 | 2006-07 | 2005-06 | |||||||
| (Rupees in Crore) | |||||||||||
| A. | ASSETS OWNED BY THE COMPANY | ||||||||||
| 1. | Net Fixed Assets | ||||||||||
| Gross Fixed Assets | 4,926.99 | 3,582.42 | 2,530.04 | 1,827.12 | 1,423.53 | ||||||
| Less : Total Depreciation | 1,082.34 | 913.22 | 811.20 | 721.93 | 680.31 | ||||||
| 3,844.65 | 2,669.20 | 1,718.84 | 1,105.19 | 743.22 | |||||||
| 2. | Investments | 51.43 | 61.78 | 47.83 | 28.87 | 29.02 | |||||
| 3. | Inventories | 916.19 | 589.06 | 442.17 | 376.88 | 255.19 | |||||
| 4. | Sundry Debtors | 542.89 | 380.17 | 273.07 | 245.95 | 184.37 | |||||
| 5. | All Other Current Assets | 398.05 | 292.46 | 491.01 | 245.28 | 170.25 | |||||
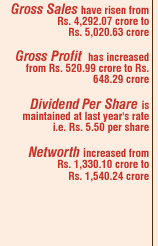
| Total Assets | 5,753.21 | 3,992.67 | 2,972.92 | 2,002.17 | 1,382.05 | ||||||
| B. | (i) | DUES TO BE PAID BY THE COMPANY | |||||||||
| 1. | Secured Loans | 1,863.72 | 1,536.27 | 971.06 | 643.20 | 413.37 | |||||
| 2. | Unsecured Loans and Deposits |
1,477.20 | 605.65 | 243.75 | 229.60 | 207.99 | |||||
| 3. | Other Liabilities | 528.62 | 363.11 | 303.03 | 226.83 | 161.23 | |||||
| 4. | Provisions | 14.99 | 31.39 | 330.39 | 135.70 | 76.22 | |||||
| 5. | Deferred Tax Liabilities (Net) |
328.44 | 126.15 | 142.77 | 112.41 | 107.19 | |||||
| 4,212.97 | 2,662.57 | 1,991.00 | 1,347.74 | 966.00 | |||||||
| B. | (ii) | THEREFORE, COMPANY’S NET WORTH REPRESENTED BY | |||||||||
| 1. | Ordinary Share Capital | 45.74 | 45.74 | 45.74 | 45.74 | 45.74 | |||||
| 2. | Reserves and Surplus | 1,494.50 | 1,284.36 | 936.18 | 608.69 | 370.31 | |||||
| 1,540.24 | 1,330.10 | 981.92 | 654.43 | 416.05 | |||||||
| Figures for the previous year(s) have been regrouped / rearranged where considered necessary. | |||||||||||


