



















| 17. | Details of pre-operative expenses incurred relating to expansion / greenfield projects referred to in Note 2A above - |
| 2006-2007 | ||||||||||||||
| Upto 31st March, 2006 |
During 2006-2007 |
Total | Capitalised / Transferred |
Balance as on 31st March, 2007 |
||||||||||
| Rs. | Rs. | Rs. | Rs. | Rs. | ||||||||||
| (a) | (b) |
(c)=(a) + (b) | (d) | (e)=(c) - (d) | ||||||||||
| Sales proceeds of items manufactured during trial run (39,685 MT of Cement) |
– | 14,04,86,759 | 14,04,86,759 | 14,04,86,759 | – | |||||||||
| Less : Excise Duty | – | 1,61,91,031 | 1,61,91,031 | 1,61,91,031 | – | |||||||||
| Total (B) | – | 12,42,95,728 | 12,42,95,728 | 12,42,95,728 | – | |||||||||
| Net Pre-Operative Expenses (A-B) |
6,12,64,893 | 33,14,42,259 | 39,27,07,152 | 32,13,65,702 | 7,13,41,450 | |||||||||
| Power generated during Trial Run (Included under Power and Fuel in Schedule 15) |
76,21,869 | |||||||||||||
| Processed / semi-processed items at the end of trial run (Schedule 14) |
11,62,01,403 | |||||||||||||
| Capitalised | 19,75,42,430 | |||||||||||||
| 32,13,65,702 | ||||||||||||||
| * Including Fringe Benefit Tax of Rs. 1,39,797 | ||||||||||||||
| 18. | Information pursuant to the provisions of paragraph 3, 4C and 4D of Part II of Schedule VI to the Companies Act, 1956 is given in Schedule 18. | ||||
| 19. | Earnings Per Share (EPS) | 2007-2008 | 2006-2007 | ||
| Number of Ordinary shares at the beginning of the year | 4,57,43,318 | 4,57,43,318 | |||
| Number of Ordinary shares at the end of the year | 4,57,43,318 | 4,57,43,318 | |||
| Weighted average number of Ordinary shares outstanding during the year | (A) | 4,57,43,318 | 4,57,43,318 | ||
| Nominal value of each Ordinary Share (Rs.) | 10 | 10 | |||
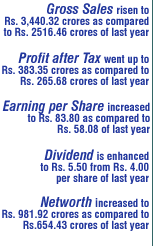
| Profit after Tax (Rs.) | (B) | 3,83,35,04,384 | 2,65,68,32,892 | ||
| Earnings per Share (Basic and Diluted) (Rs.) | (B/A) | 83.80 | 58.08 | ||



























